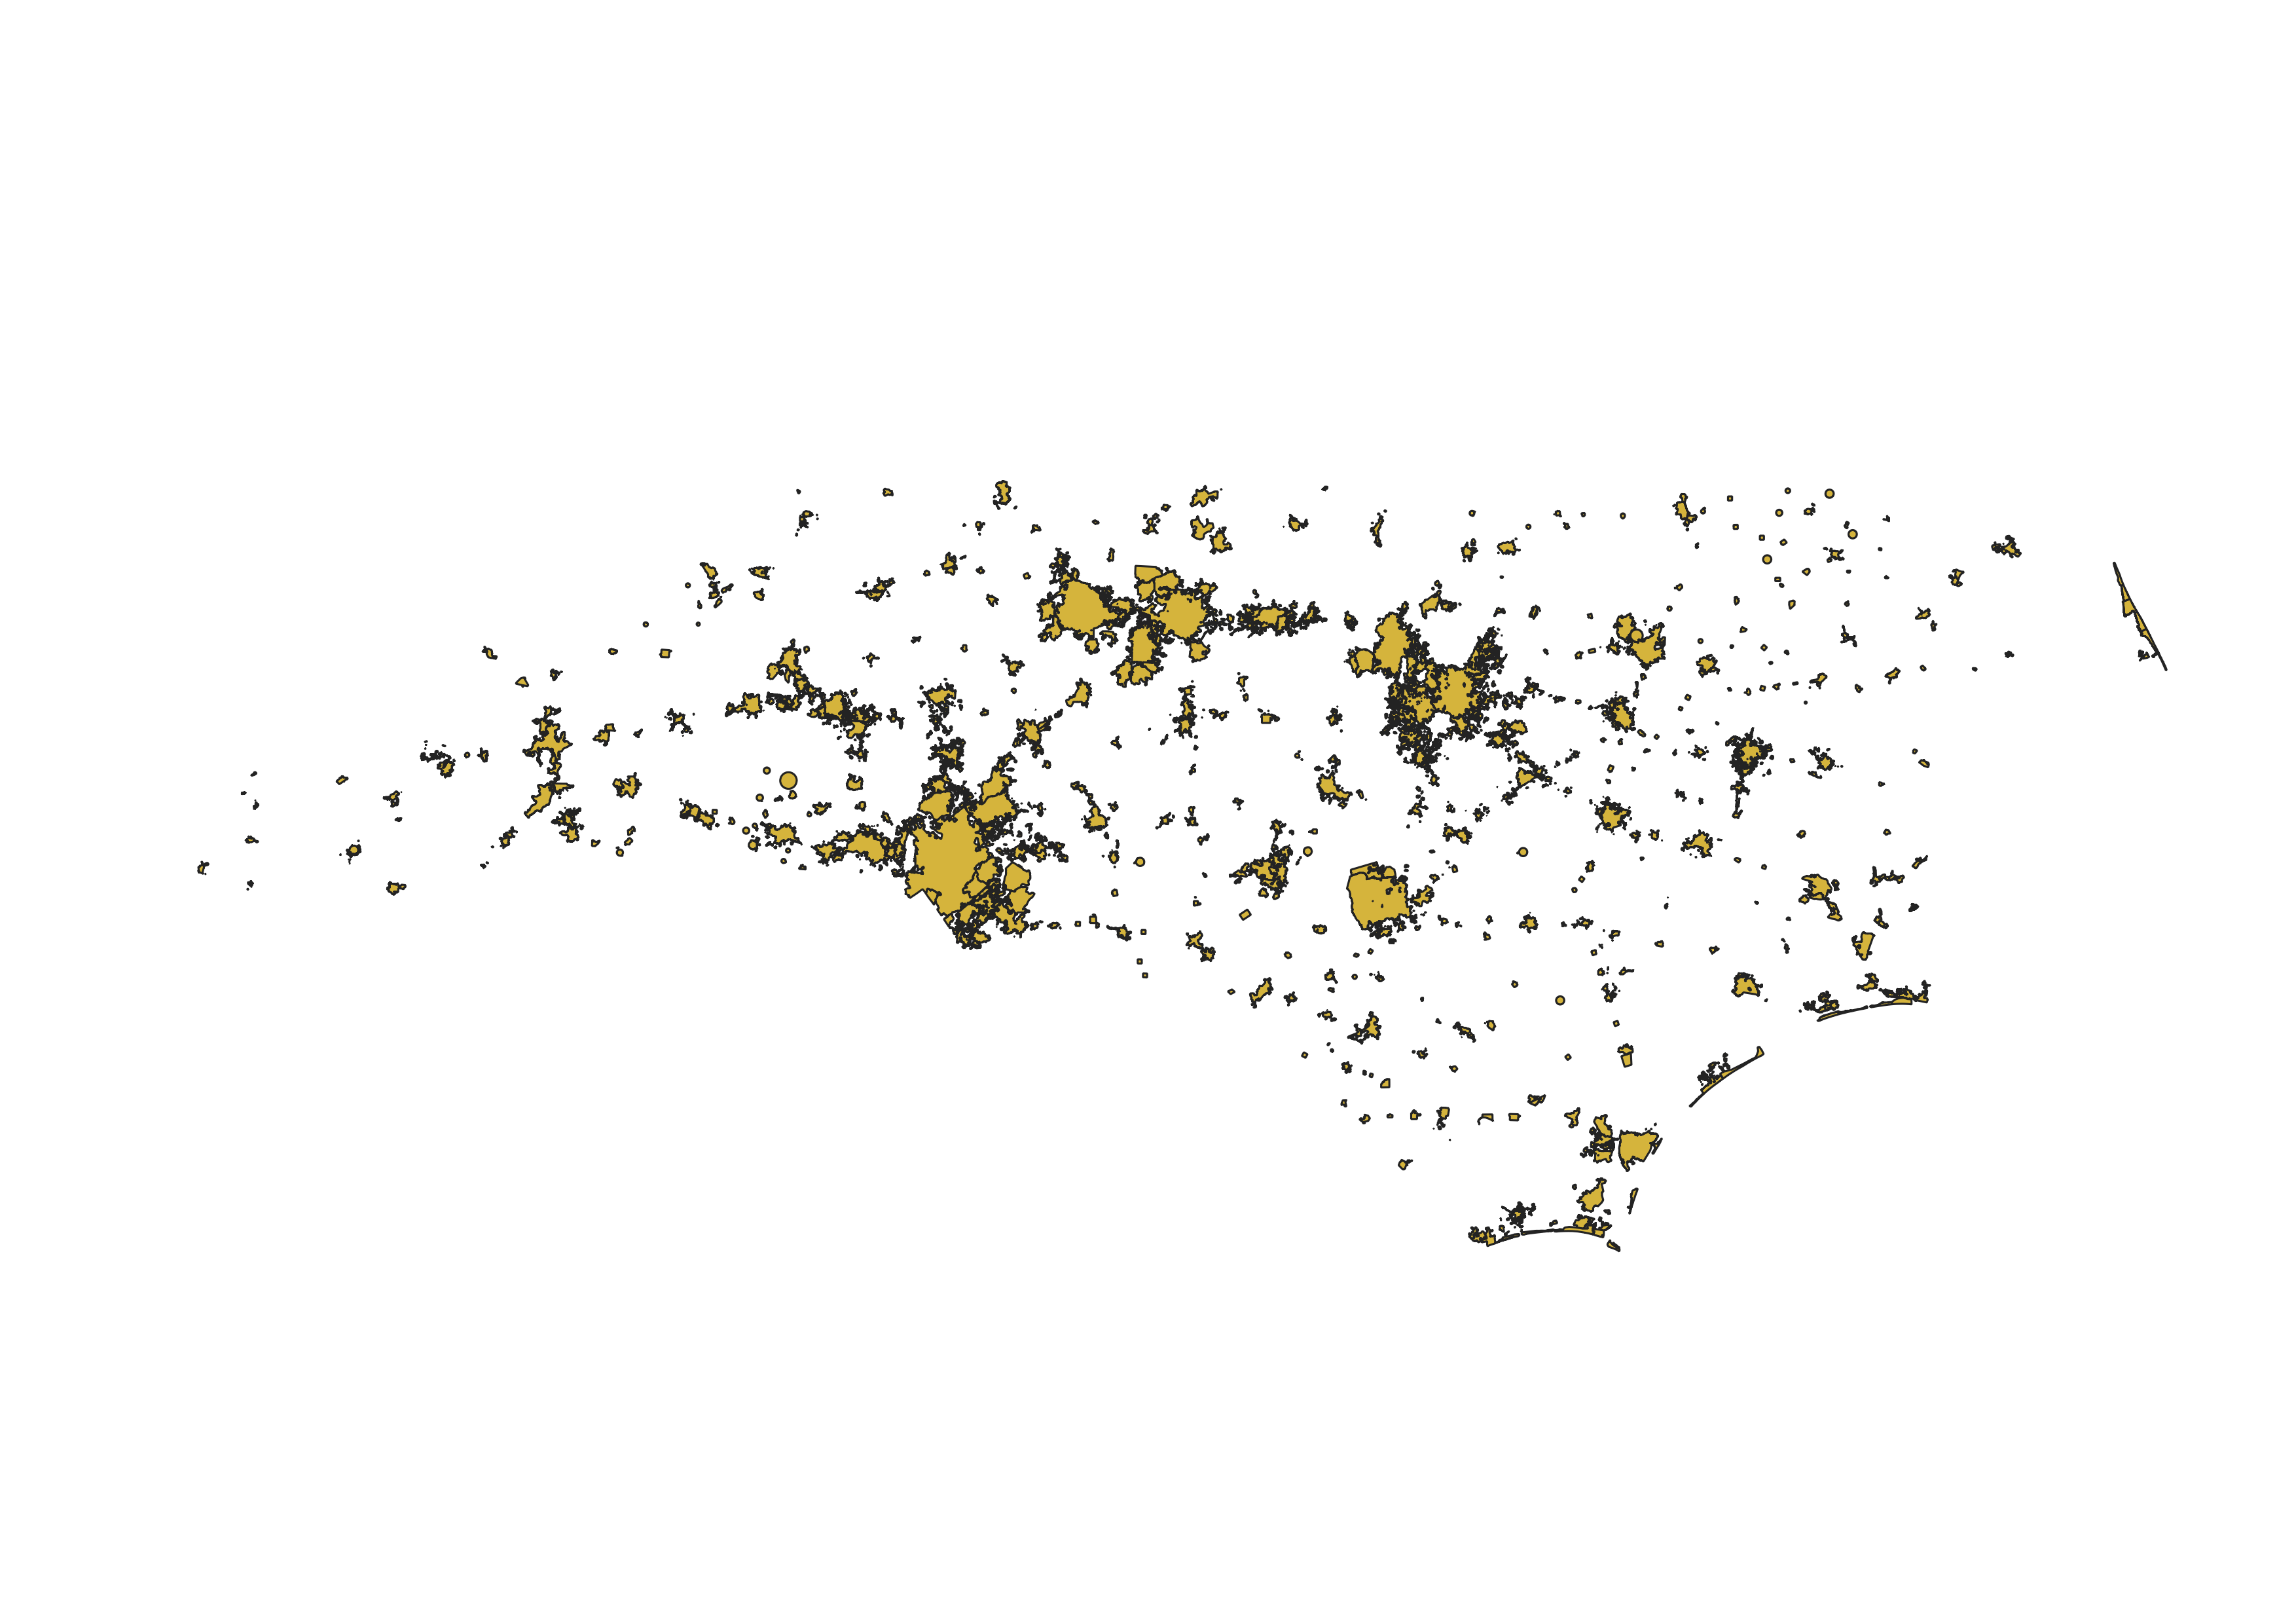
This is how I made the Run Raleigh Project. It started with finding out which roads are in Raleigh. But that started with finding out where Raleigh is. I used a shapefile of NCDOT city boundaries from NC OneMap and brought it into QGIS:
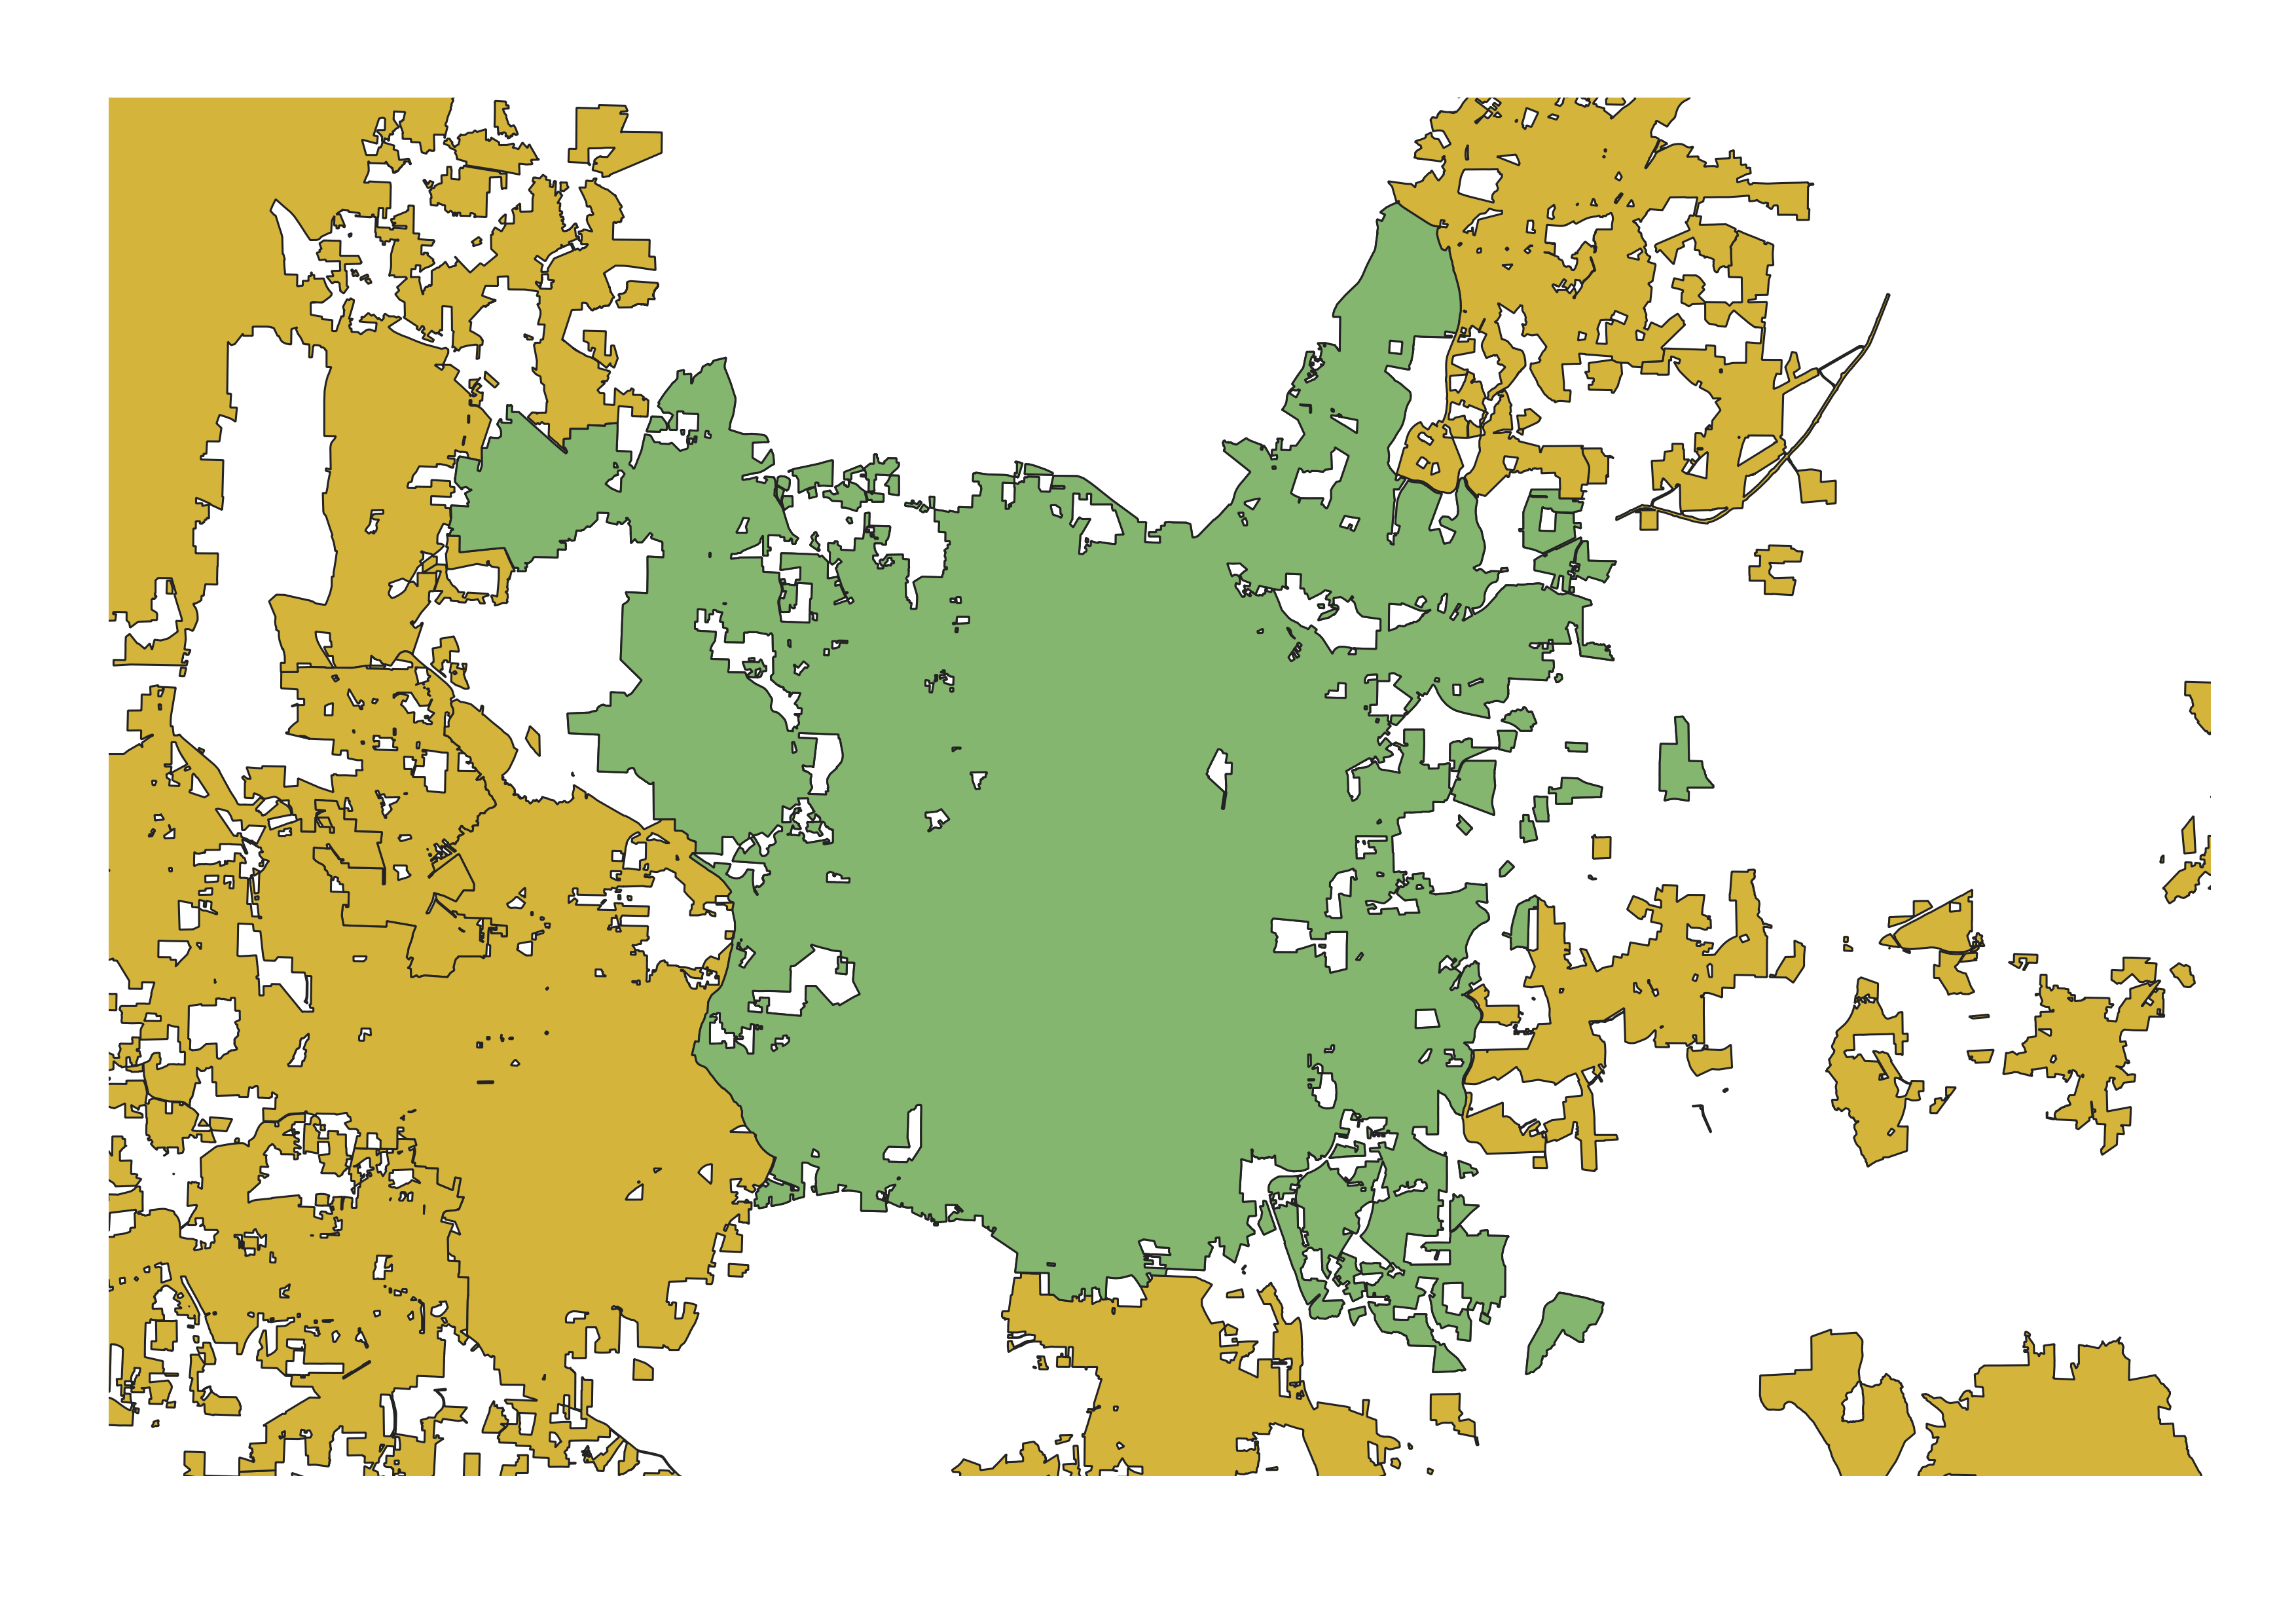
Then, I could select Raleigh city limits only and create a new layer:
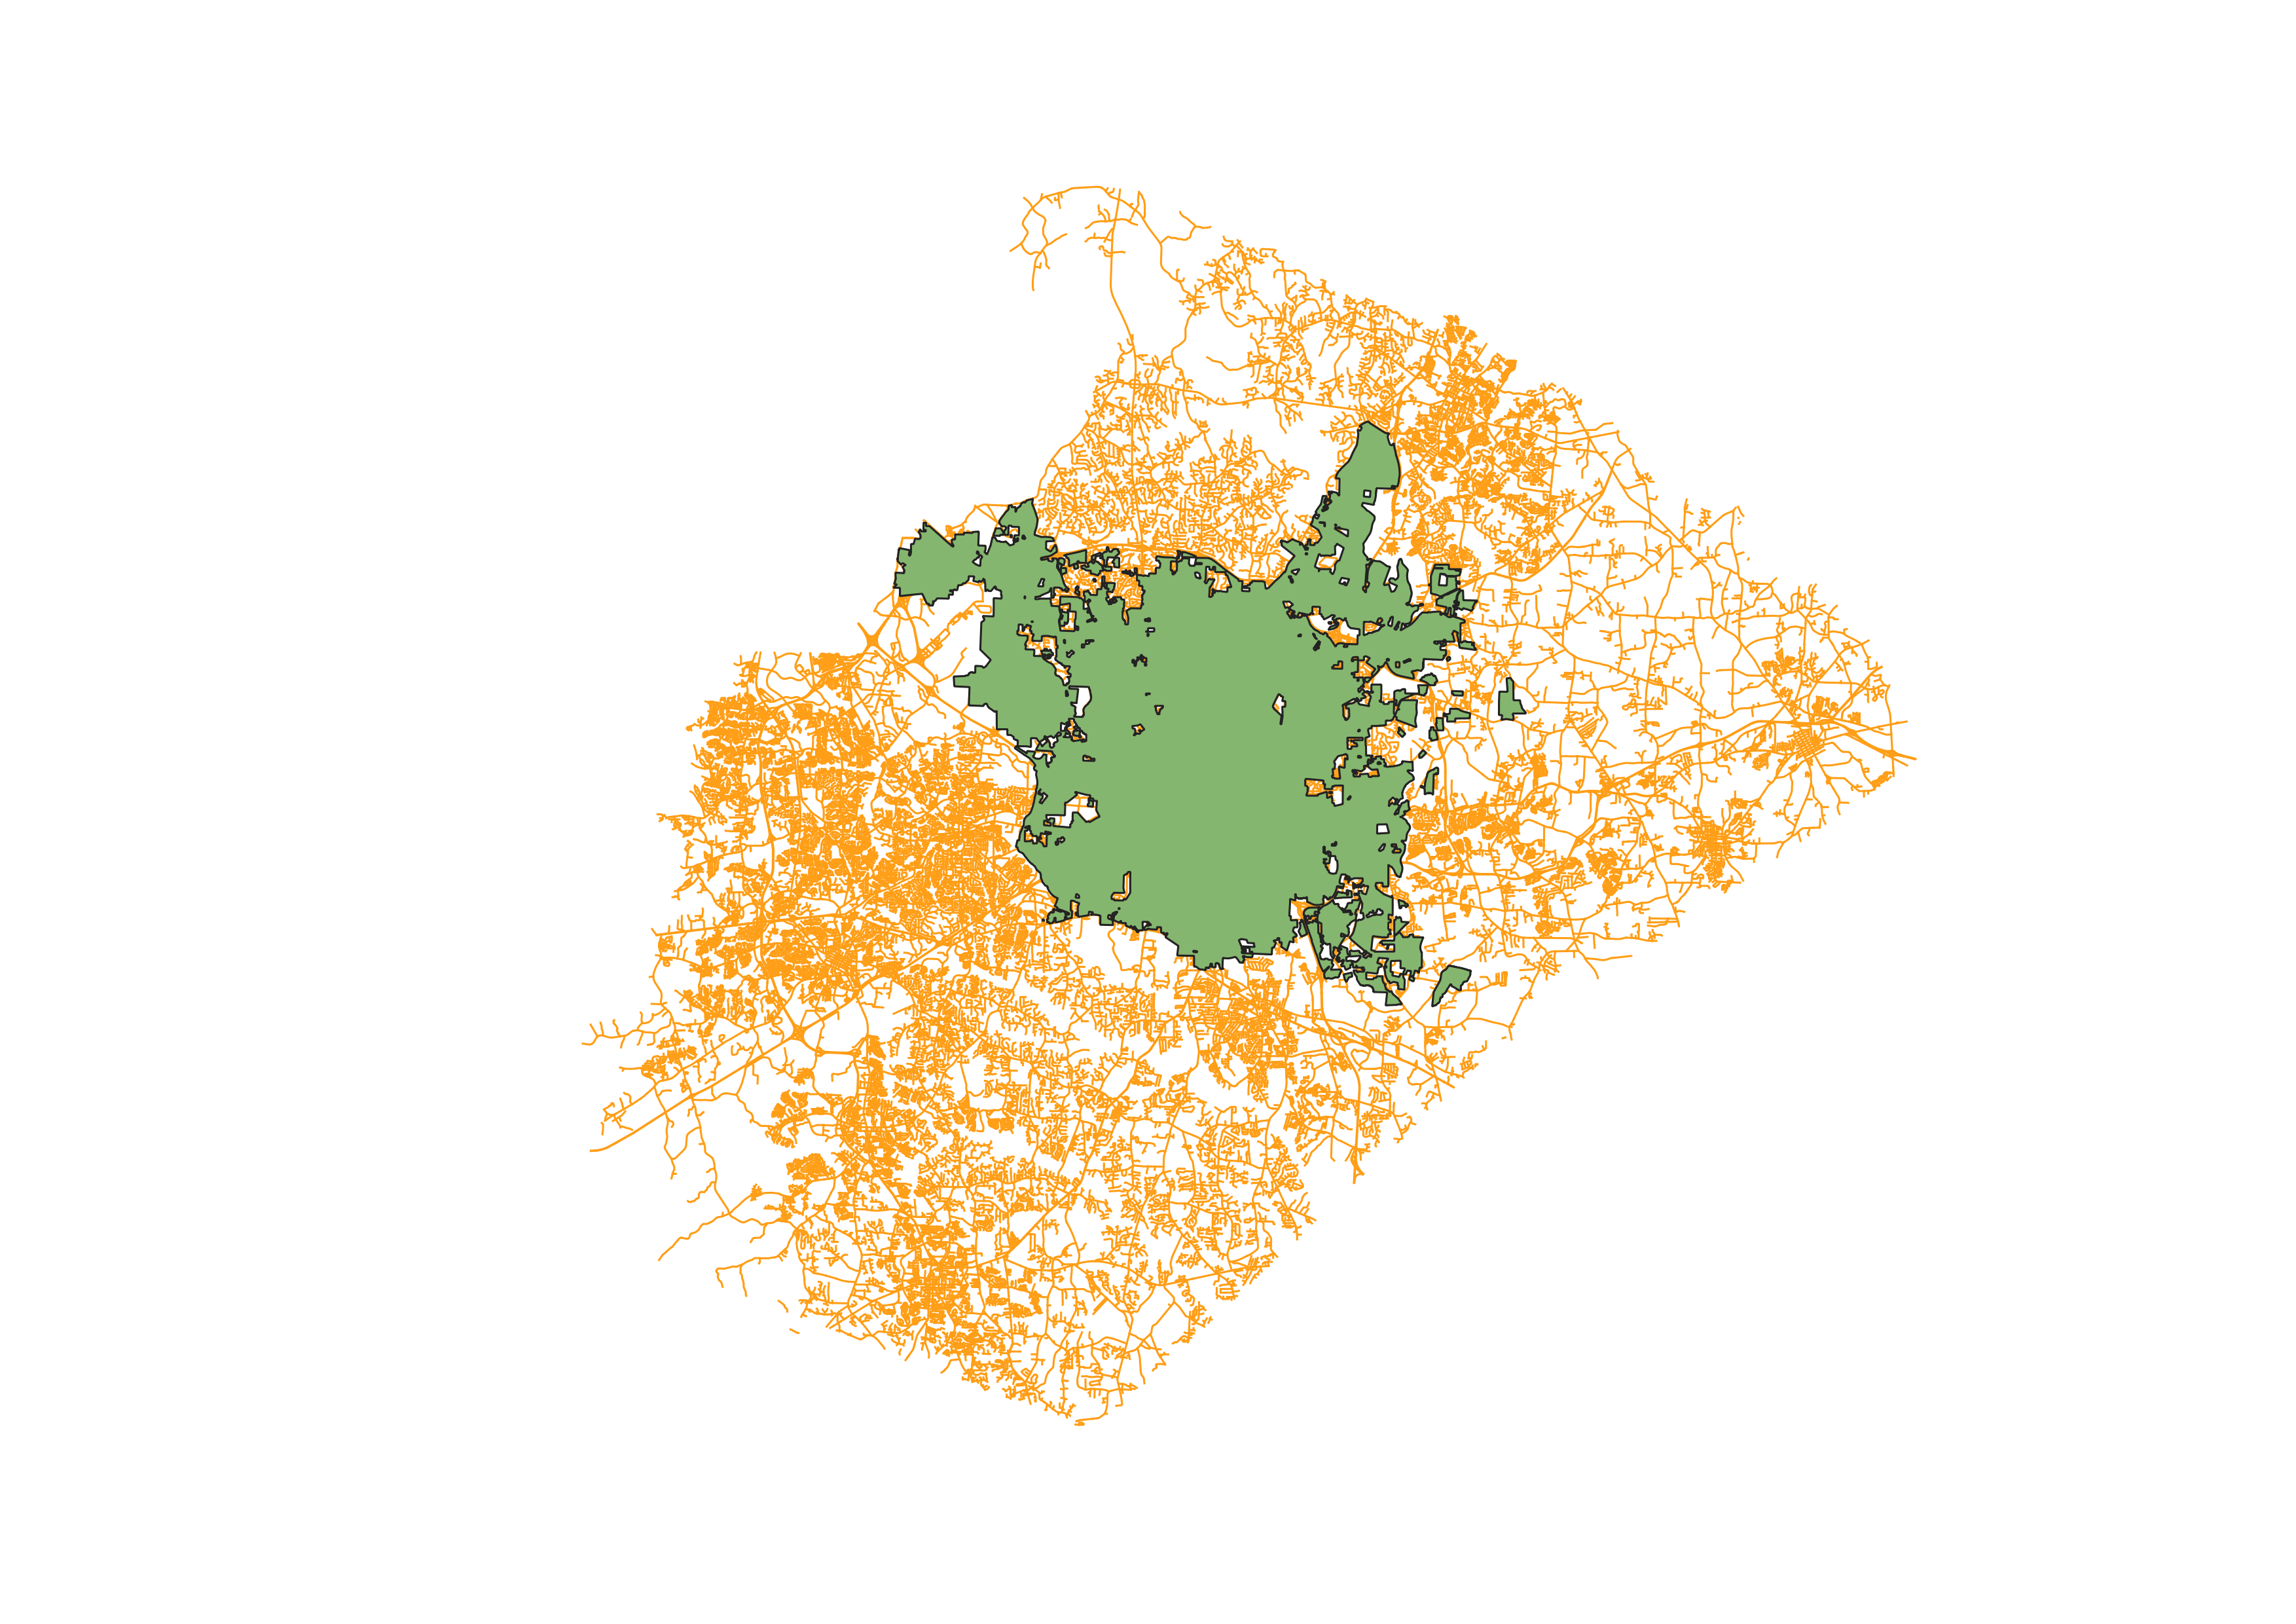
I got street centerlines in Wake County NC from Raleigh Open Data:
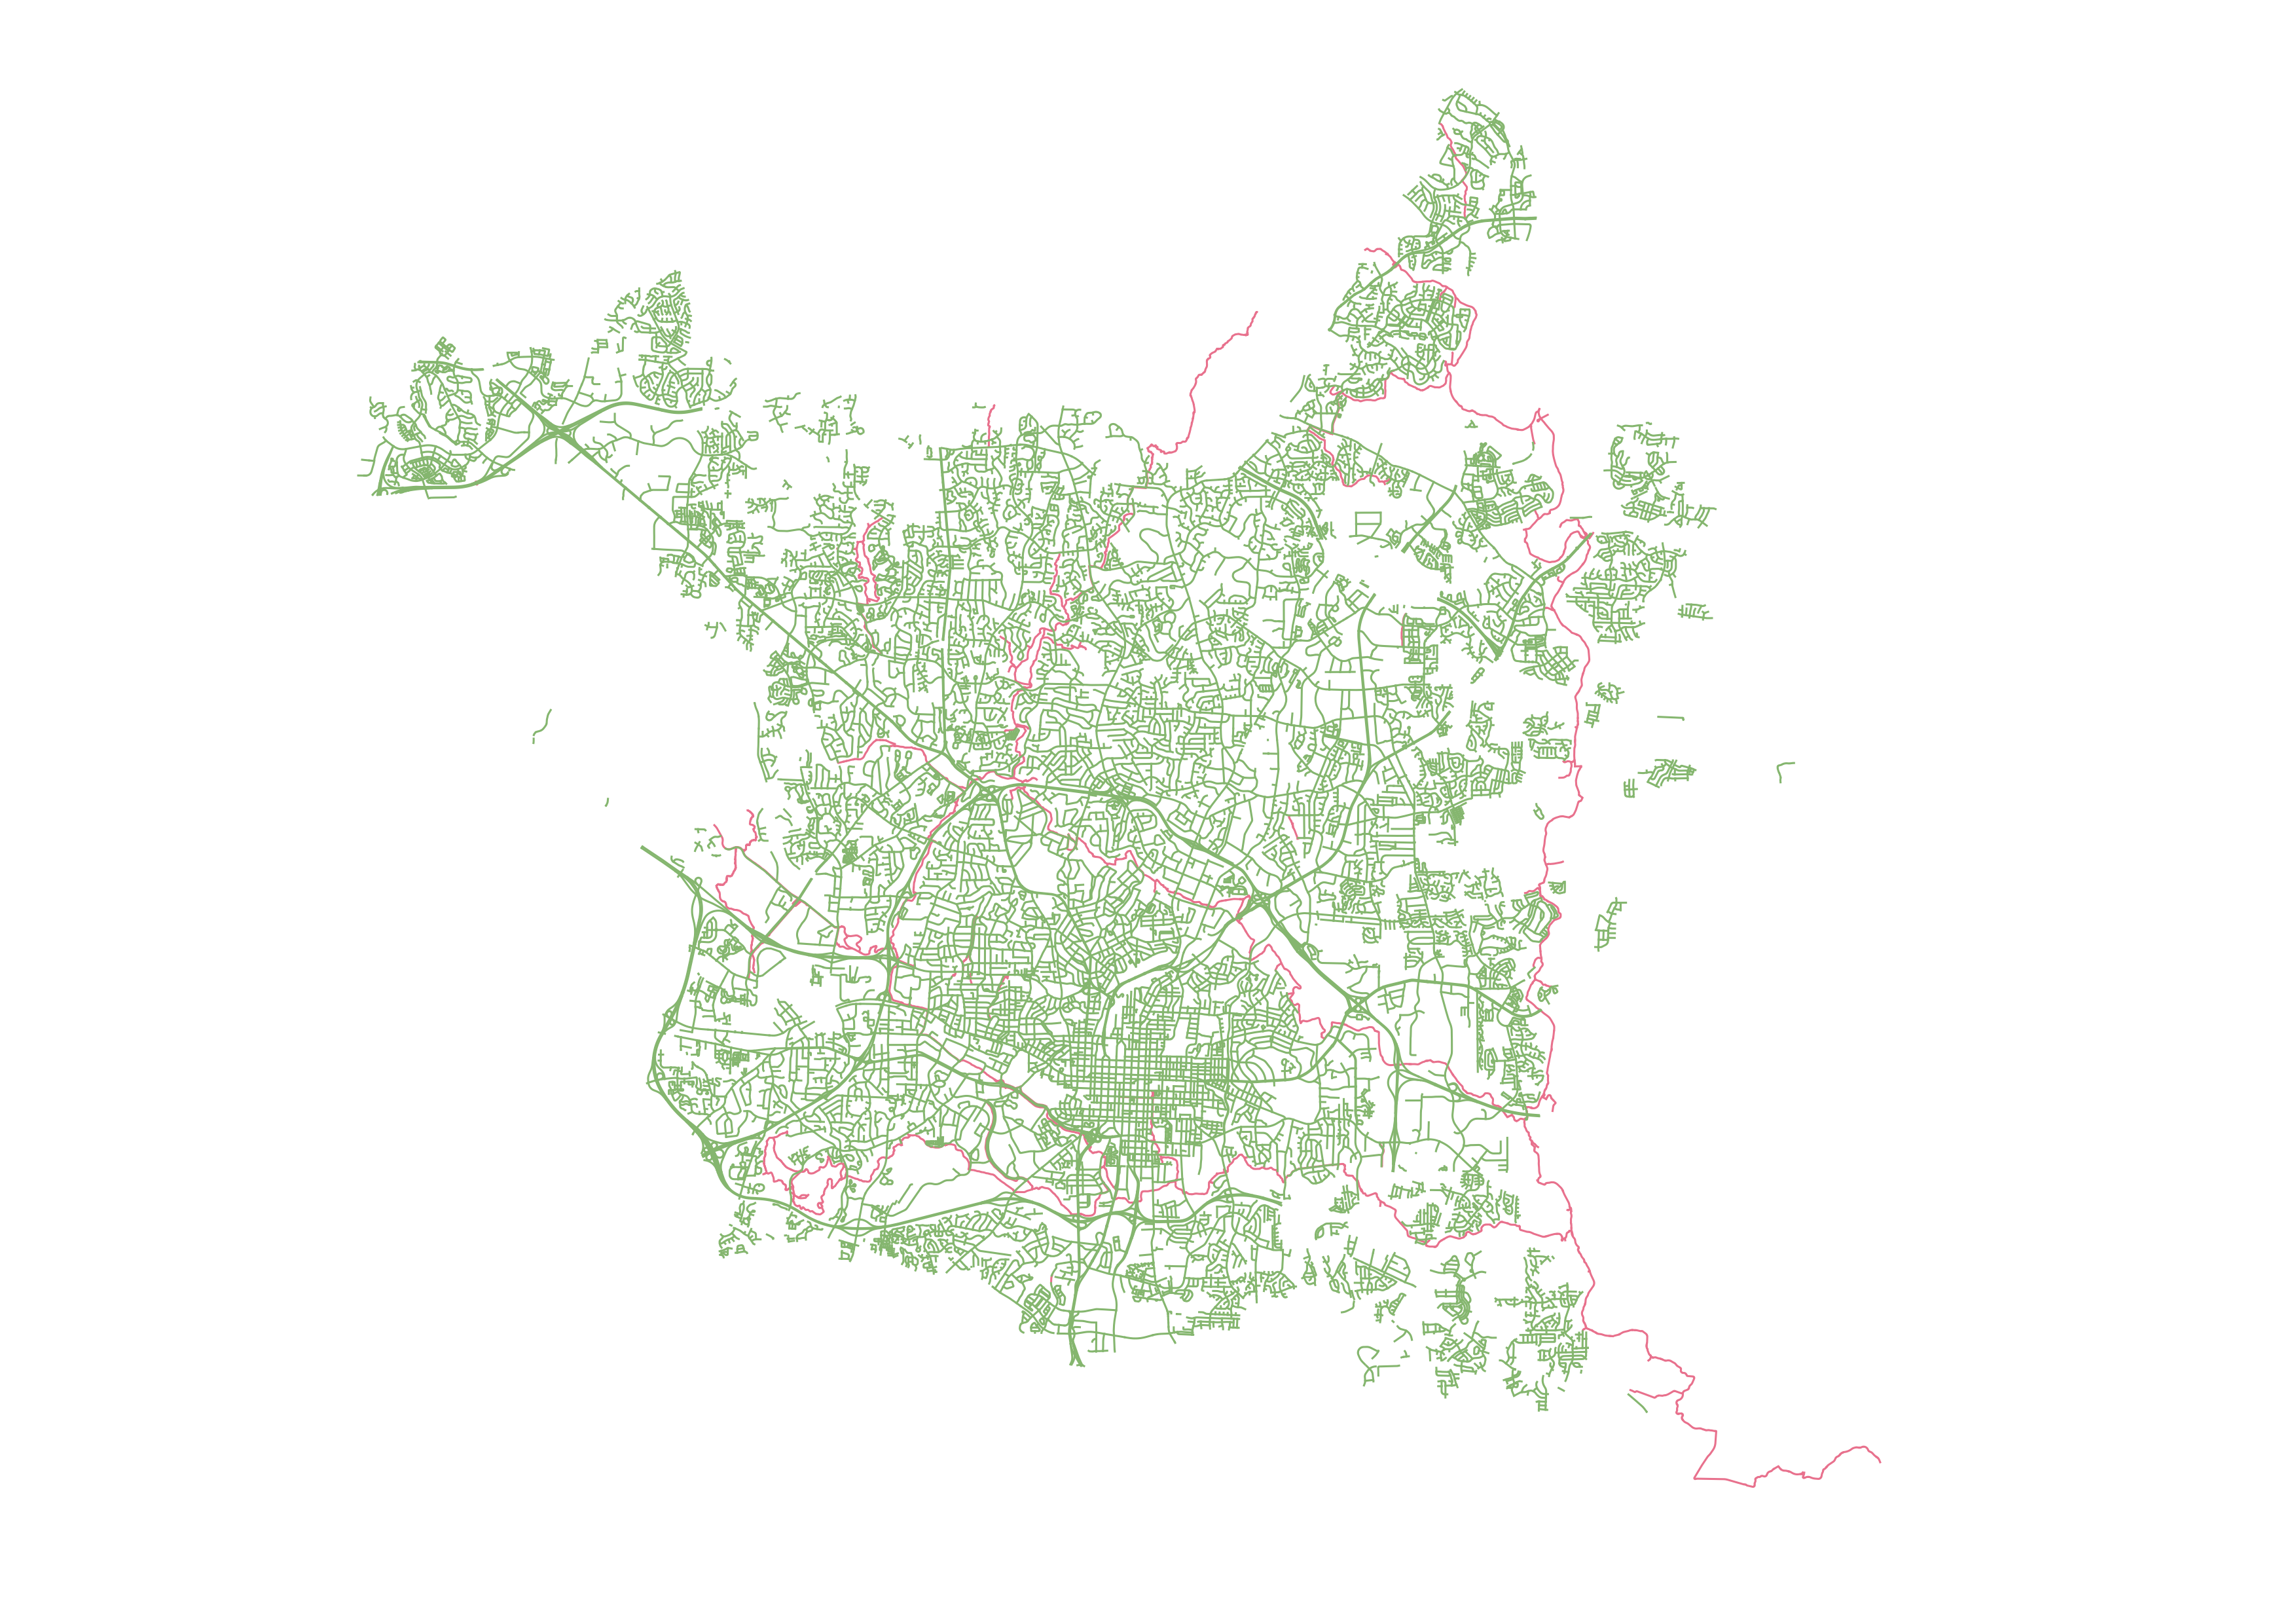
Haven't the default colors just been stunning?! ... I clipped these two layers to yield only streets in Raleigh:
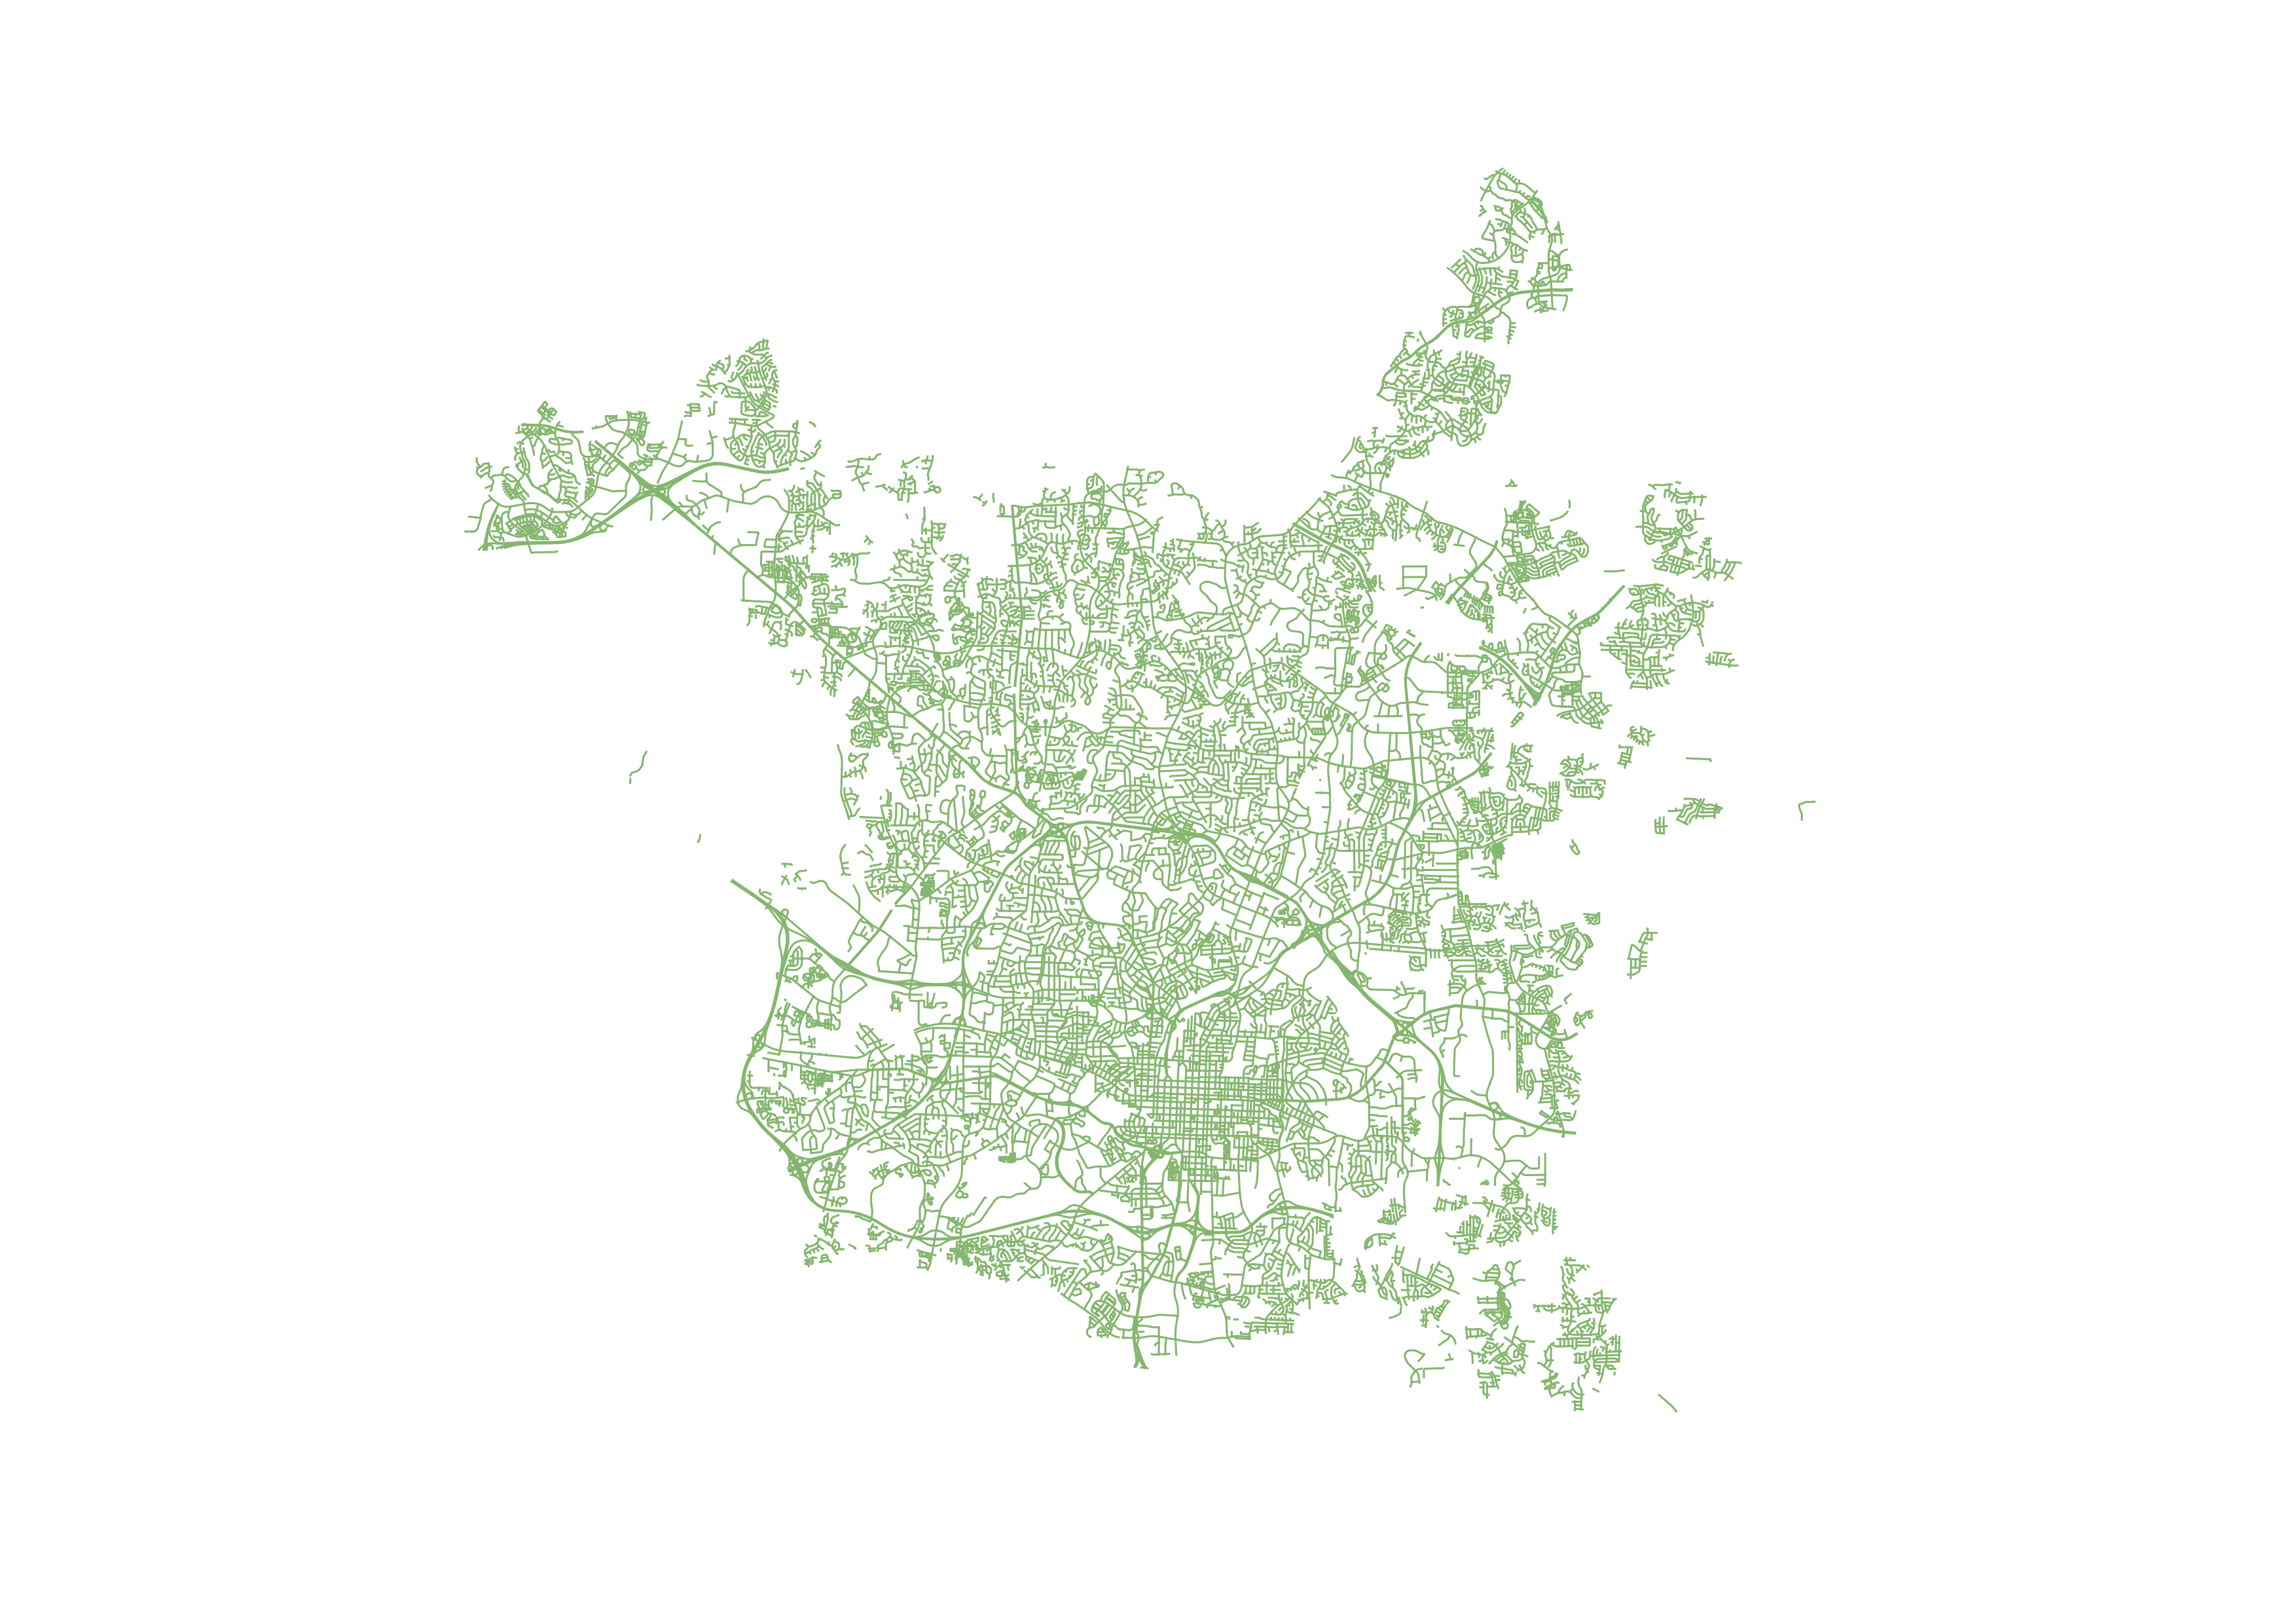
Immaculate. Raleigh Open Data also had a Greenway Trails data set that I added.
From QGIS, I exported the newly trimmed shapefiles as .csv files and added them into RStudio. I used RStudio because it was already installed on my computer when I started this project. I wanted to use PyCharm since that is what I used more of in school, but it turns out that costs money for not-students?
Looking at the two data sets I got, the streets looked extremely messy. The Greenway file was interesting - it had different surface types listed for different segments of greenway, e.g. concrete, asphalt, decking, etc. That gave me a neat milestone idea: run across every wood bridge.
Back on topic, the reason I brought these into RStudio was to get all the individual road names greenway names.
For the greenways I used unique(RalGreenways$TRAIL_NAME)
on my newly created RalGreenways.csv to
determine there are 26 greenways in Raleigh. However, it was time to start thinking about how to bring my runs
into this process.
I use a Garmin Forerunner 35 to get GPS information for my runs, and log about everything on Strava. From Strava there is an option to export the run GPX, and with this I could add the run into QGIS. Here's an example below with the run track shown in blue:
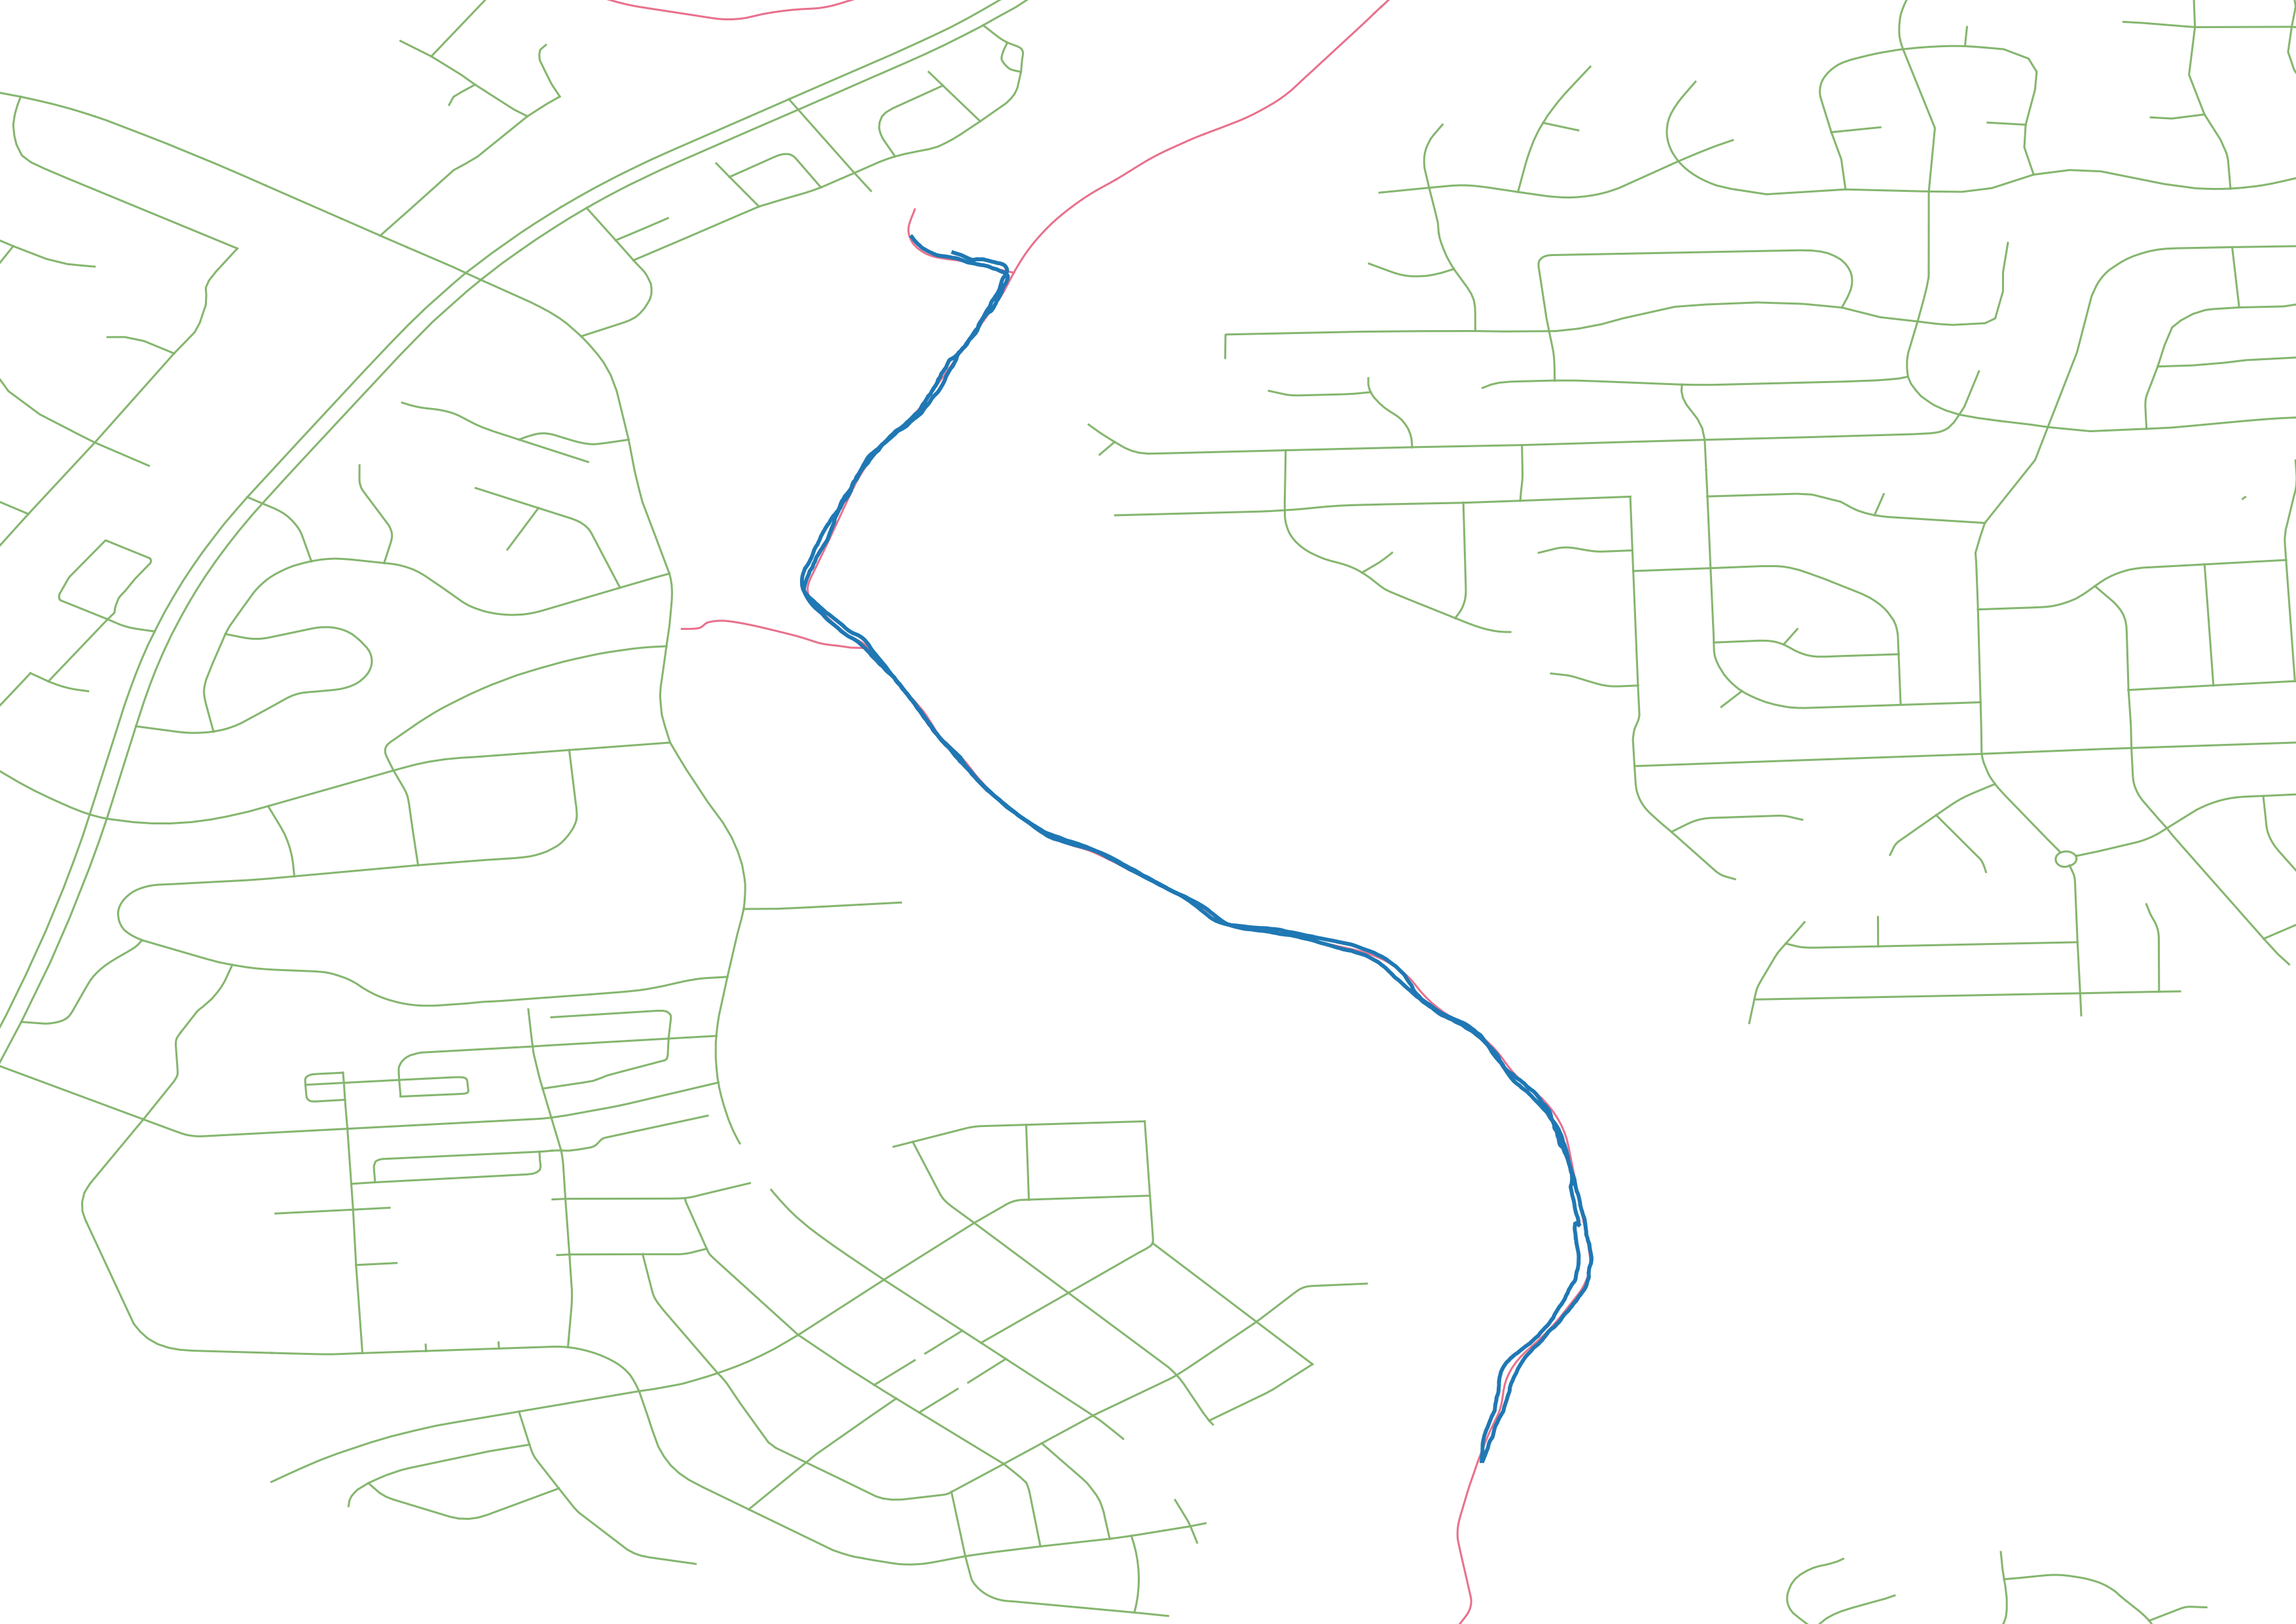
My solution to see if which roads or greenways the run covered was to make a small buffer around the run track, then perform a clip against the greenway and/or road shapefiles. I had trouble with the buffer geometry because the Strava GPX was not in the same projection as Raleigh's data sets. I changed everything into EPSG:2246 that has better accuracy for North Carolina. I still had to change the buffer distance to be .0001 feet, so I'm not convinced I solved all the projection problems, but that was good enough.
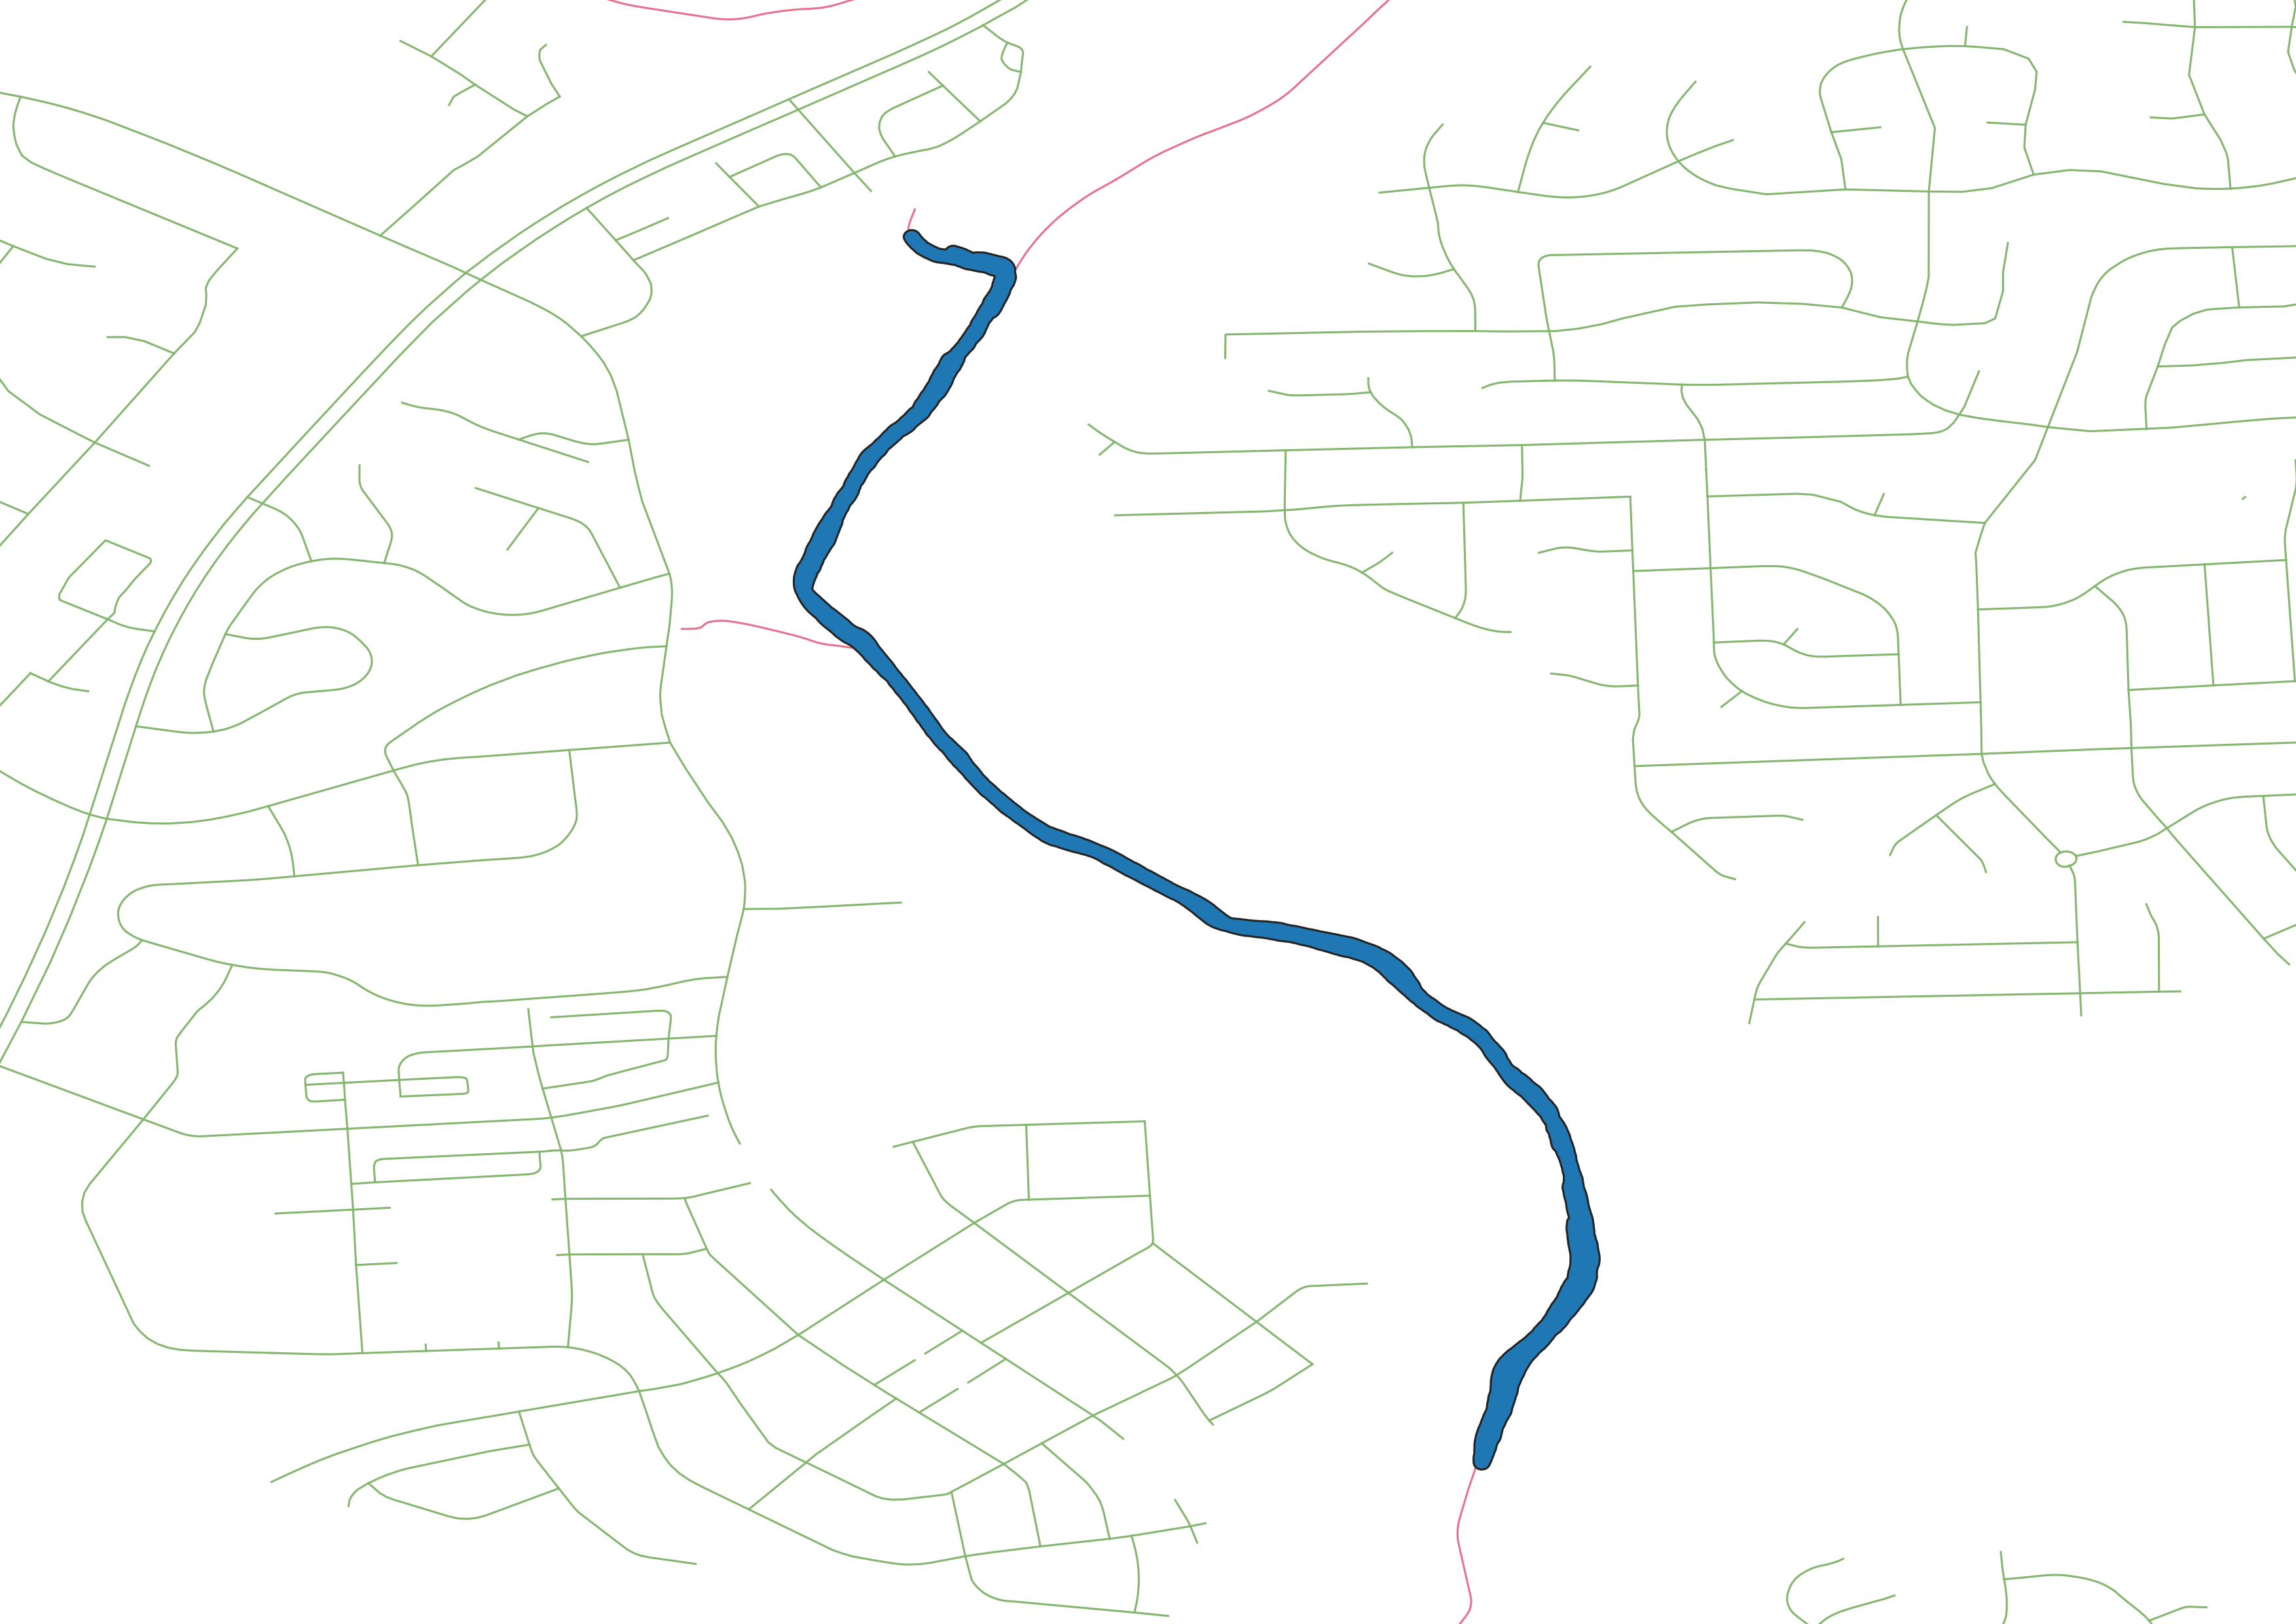
To measure progress, I can take the intersected greenway sections, get the total distance with the convenient
MAP_MILES column
using sum(ExampleRun$MAP_MILES,na.rm=TRUE),
and get a percent completion against the total miles in the greenway and against the total miles in all
greenways. Just checking against this arbitrary run, the total miles from the clipped greenway vectors were much
greater than the distance of the run. I think this means some of the segments overlap and some distances get
counted several times. To me this means I cannot trust this QGIS geoprocessing to get me the absolute miles
covered, but I believe the relative completion yielded from geoprocessing should still be accurate.
It's time to work on displaying the data in a neat way.
It's time to learn to use Leaflet, the leading open-source JavaScript library for mobile-friendly interactive maps. Weighing just about 42 KB of JS, it has all the mapping features most developers ever need.